This content is restricted to CTU members
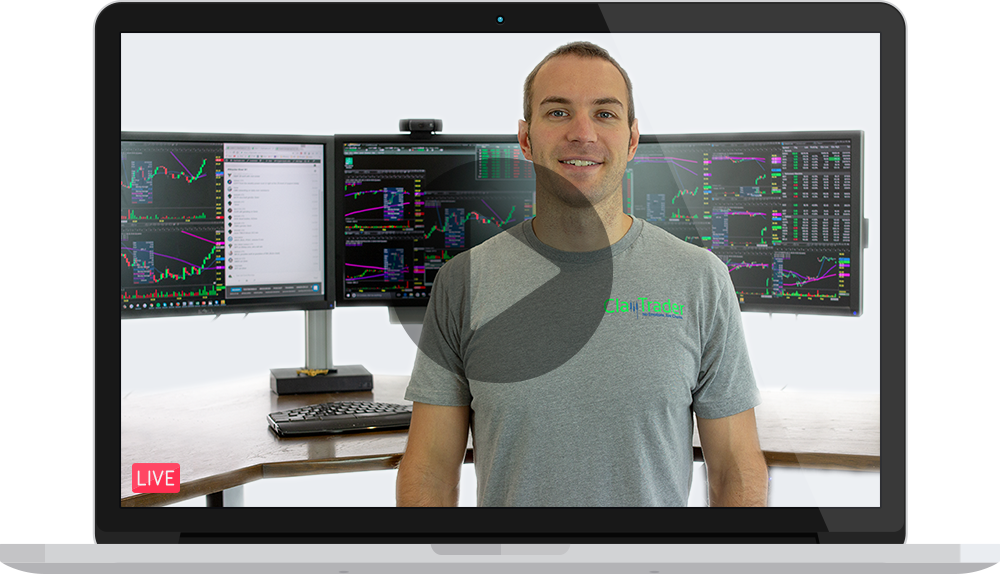
In this weeks webinar we are doing live scans. We start off looking for long upper shadows. Since we use multiple time frames we can find various levels of support and resistance in the form of moving averages, fibonacci levels, candle formations and historic levels.
We then look for some trampoline plays. We scan for 20% short float and within 5% of 50 day lows. We then flip this scan on it’s head and look for similar setups but within 3% of the 50 day high (which means the shorts are really under pressure).
