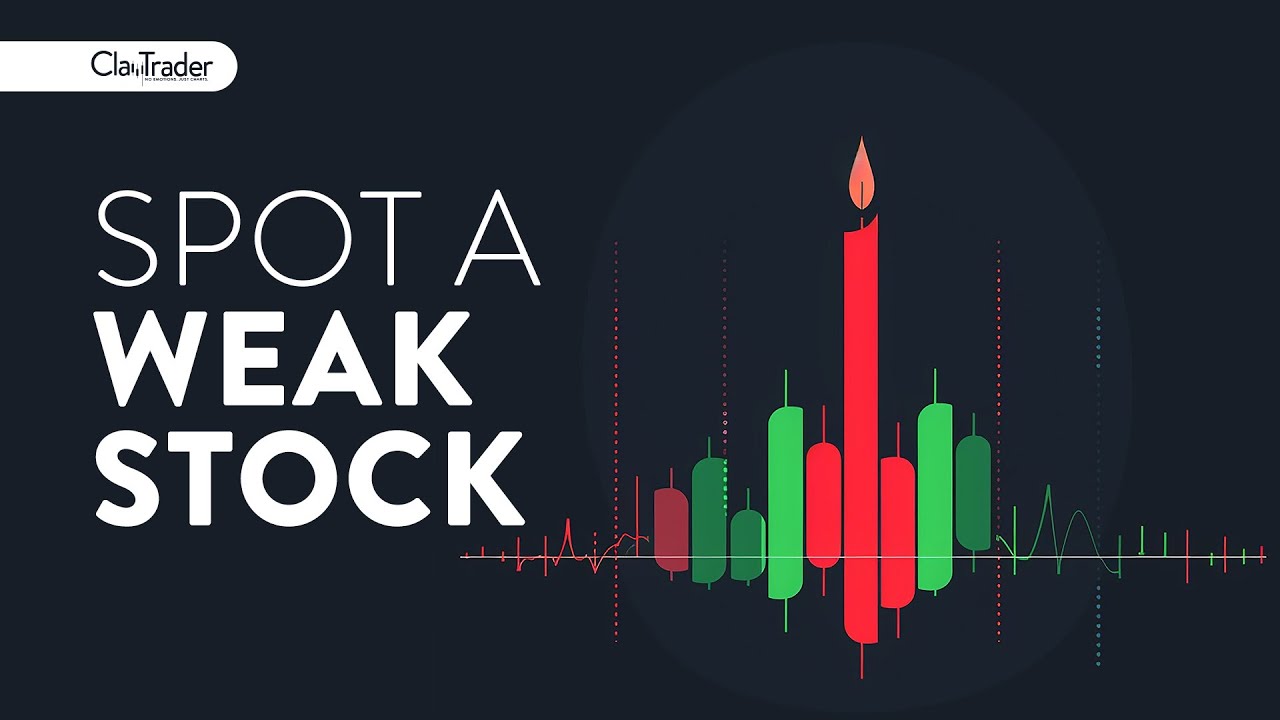
In this video, I explain how to identify weakness in a stock using candlestick charts, focusing on the significance of long upper shadows. We begin with a technical overview of candlestick components—bodies, upper and lower shadows—and how they represent price movements within a specific time frame. I illustrate how a long upper shadow indicates that although prices reached a high point, they did not sustain, signaling potential weakness. By recognizing this pattern, I demonstrate through a real trade example how I made $500 in five seconds using options trading. We explore how this method applies not only to stocks but also to options, futures, and cryptocurrencies. Understanding this concept can enhance your trading strategies and decision-making processes.