Throughout my years of stock trading experience, there has always been a constant stream of questions and comments I receive that clue me into the fact that many traders do not truly understand how technical analysis works.
 Sure, technical analysis works as a tool that stock traders use to profit in the marketplace. I can’t deny that.
Sure, technical analysis works as a great strategy to learn how to remove yourself from the vicious cycle which is the reason most stock traders fail. I definitely can’t deny that since it is what rescued me from the cycle of failure.
Sure, technical analysis works as the best tool in my opinion to follow the most important rule for stock trader success. I can’t deny that either.
None of these answer the question of how does technical analysis work however.
Technical analysis works to create successful trades because its ability to remove the emotions that many stock traders experience while trading.
I’m a very “hands on” learner. While I don’t have any problem with theoretical statements or notions (heck, I just made one above), I just have always been a person that learns more efficiently through real life examples.
With this being said, I feel the best way I can explain and show how technical analysis works to remove emotions is through a personal experience.
How Technical Analysis Works to Control Trader Emotion
Quickly, I want to start with some background information. I am the head editor of BullWarriorStocks.com, a micro cap trader blog. Every weekend I run scans and find technical stock chart set-ups that I place in one of five categories.
At this particular point in time, I determined the technical chart for Applied DNA Sciences Inc. (APDN) to have bullish potential so I placed it into the Pattern Play category.
(Note: Put your feelings aside about micro cap stocks (whether bullish or bearish). That is not the discussion or topic of this article. It’s all about technical analysis and price action.)
When I first alerted it to the subscribers of the blog (click HERE to see actual newsletter that was emailed), the chart appeared as follows…

As you can see on the annotations above, I clearly noted it was a Symmetrical Triangle Pattern, and although you can’t tell from looking at my annotations, I was extremely excited about the bullish potential of this chart.
How Technical Analysis Works Example #1
There is one word that maybe you caught: potential. The chart looked awesome and my emotions were undoubtedly that of super excitement; however, there was nothing given in terms of an actual buy signal for the set-up. In this instance, technical analysis works by helping me to avoid buying into a stock that I really had no reason to.
Buying into a stock with no “buy signal” would be what many consider crazy, yet, it happens on a routine basis for the novice and beginner stock trader.
So thanks to technical analysis, I didn’t go rushing into a stock without any logical reason to do so.
After the week I alerted APDN was completed, the chart then appeared as follows…

Simply put, nothing happened during the week. I mean nothing. The price just chugged along at very average/below average volume and did nothing.
To keep things polite, I will just say that I was extremely bored with this chart. It got even better when being bored turned into being extremely frustrated because this chart I had been so excited for turned out to have such a lackluster week of trading.
How Technical Analysis Works Example #2 & 3
I don’t care how bored I was, it would have been ten times worse had I let the excitement emotion control me in the first place.
So thanks to technical analysis, I never got into the trade and it was much easier to deal with the price action from an emotional standpoint (or lack thereof) during the week.
This leads right into the next major safeguard technical analysis provides. My emotions of frustration were now yelling at me, “Get this piece of junk off your watch-list!”… “That week sucked! So boring! Waste of time!”… “Time to move on and find a real winner! What a loser this chart is!”
Wait, huh? What the heck were my emotions talking about?!?! I know how to read stock charts, and this chart was not giving me any reason to stop tracking it. It was basically the same exact chart as the previous week. The trend lines needed extending, but the Symmetrical Triangle Pattern was still completely intact. Essentially, nothing had changed from a technical perspective, it was “still” the same pattern. The only that had changed was my emotions. At this point, I told my emotion of frustration to “shut its mouth” because it clearly had no idea what it was talking about (and rarely do the emotions when trading).
So thanks to technical analysis, I decided there was no technical reason to remove the chart form my watch-list, so I kept on following.
In fact, not only did I decide I was personally going to keep following the chart, but I re-alerted it to the subscribers of the blog again! Take note on the chart below how I even mentioned to the subscribers that I was “not gonna give up” on the set-up.

If you would like to see the actual newsletter that was emailed out, click HERE.
How Technical Analysis Works to Create Success
I really don’t think I need to say much at this point as a picture is worth a thousand words. Thanks to technical analysis and its controlling of my emotions which kept the chart on my radar, the following week produced quite the bullish opportunity…
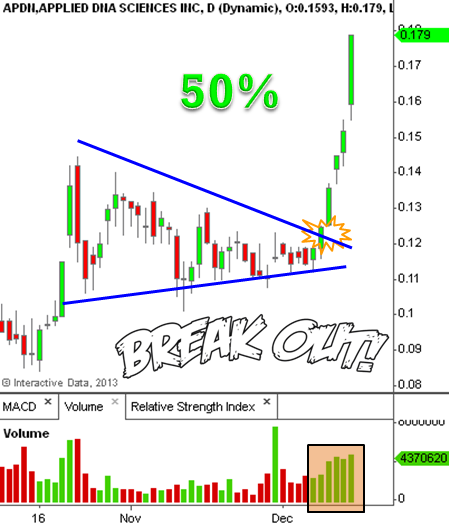
That Monday morning APDN broke through the resistance portion of the pattern at $.12 and for literally five straight days put in new highs. On Friday it hit as high as $.18 for a total ‘profit potential window’ of 50%.
And to think… I was soooo close to listening to my emotion of frustration and removing this one completely from my watch-list.
This real life example shows exactly how technical analysis works and why I love using it! Thank you charts!
Are You Trading with Technical Analysis or Emotions?
Can you relate to any of this? Ever go through these same types of thought processes and emotions? I know I have, and I still do!
The only difference at this time in my trading career is I know how technical analysis works, so I choose to utilize it! As this real life example shows, not only does using charts save me from massive amounts of stress, it also kept me focused on a chart that turned out to be a massive winner! I tell you what… trading life doesn’t get much better then that. Low stress – high profits. I will take that all day long!
And so can you. Sure it will take some time on your part to learn technical analysis and how to read charts, but in the long run, being able to remove your emotions from your trading will pay for itself over and over again.
I love to teach and assist traders in this journey, so I would encourage you to check out my educational training store and the instant download courses. I have courses designed for new traders all the way up to traders who are looking for advanced strategies and trading tactics.
Be sure to contact me HERE if you have any questions or comments.
