I’m a big fan of efficiency and killing multiple birds with a single stone, so that’s what I’m going to do here. I get asked all the time how the private trading chat room operates and works?, so by answering this question, it will allow me to hit upon a few other key points.
 I’m also going to show why I believe using the powerful duo of a chat room in combination with technical analysis (the use of “charts”) is something all serious traders should consider.
I won’t lie, the real life case study I am going to use is also a great example to utilize in order to poke fun at some of the ignorant trolls out there. These trolls love to proclaim that “charts are a scam” and nonsense such as that. I’ll be the first to admit, if you are trying to use charts as a crystal ball, then you’ll be disappointed (and this is why charts sometimes get a bad rap, because scumbag marketers are lying about how they should actually be implemented). There is no such thing as a crystal ball in the markets, however, if you are using charts how they are supposed to be used, as I explain here, then they are without question a very valuable trader tool as you are about to see.
Let’s get to the case study and hopefully have some fun along the way!
The Trading Chat Room Alert
I want to break this all down step-by-step of how it unfolded in our private community, that way you can see exactly how the powerful duo of a chat room and technical analysis acts as one to create profitable scenarios.
A Team of Eyeballs
 I hope we can all acknowledge the fact that we’re human beings who only have two eyeballs, unless you’re like the terminator or something… anyways… I bring up this fact because as good as our set-up may be with scanners, screeners, filters, and many monitors, you sometimes just can’t “see it all”.
But this is where a massive benefit of a chat room comes into play (they also have other benefits such as being healthy for your trading account). If you are working as a team to locate ideal set-ups, you now all of a sudden have more than two eyeballs, you have MANY eyeballs who are searching alongside you.
The Trading Chat Room Alert
In this case, I alerted ticker OPTT (Ocean Power Technologies, Inc.) at 9:33 am est. on July 20, 2016 as you can see below…

The above alert won’t be what we’re focusing on, but I wanted to illustrate the learning point that just because you may miss out on one set-up does not mean the stock won’t give you another set-up to work with and trade.
Later on in the morning at 10:19 am est., I again issued another alert, this time, with a little twist of actually drawing up the technical pattern…
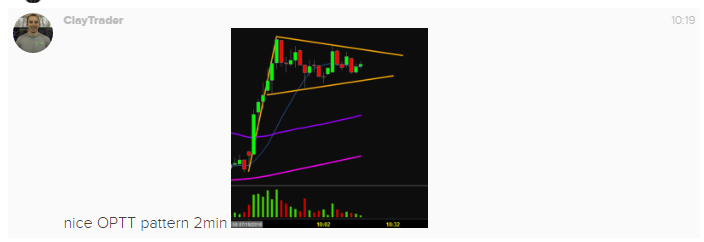
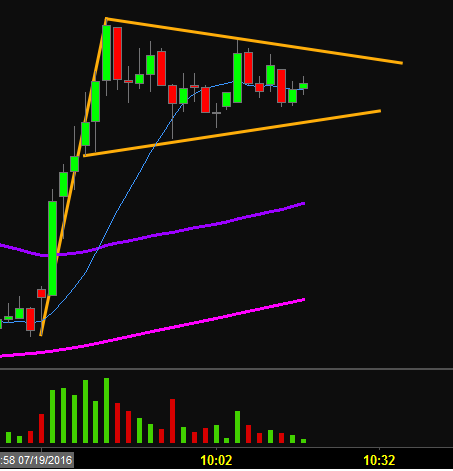
I realize that may be a bit hard to see, and it’ll be important that you can see it clearly, so here is the same image just made a bit bigger. The key aspect to focus on are the orange trendlines I drew into place.
The Power of Trading with Charts
I’ve used charts now for multiple years, and they still never cease to amaze me. Take note in the image below of the pink circle. I assure you, I did not adjust the orange trendlines in any way. I mean if you don’t believe me, then that’s why I’ve posted all the previous images, so you can see the lines have NOT been adjusted.
Anyways… back to the pink circle, notice how the price rose and rose and rose and then BOOM, right at that spot, the price got rejected. Crazy huh?
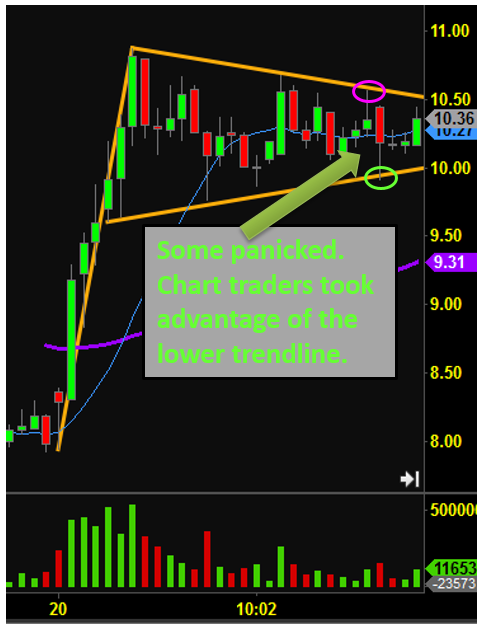
The pink circle represents a high of $10.57. In the span of less than four minutes, the price quickly dropped down to $9.91. That’s a big drop in a very short amount of time, however, notice where the price conveniently decided to stop going down – right at that green circle whose location is smack dab at the lower trendline of the pattern. Crazy huh?
While amateur traders and those who don’t use charts could have very easily panicked (again, that was a big drop in a short time span), the cooler heads who were utilizing technical analysis in their trading have an awesome risk vs. reward buying opportunity.
With all that being said, we’re not going to assume anyone played it perfectly. We’ll run our calculations from the $10.50 mark. Why? That’s where traders who wanted to “buy the breakout” would have been ready and waiting. Of course, if you weren’t using charts (or in the chat room), you would have had no idea that $10.50 was the key price level to break.
A Quick Recap of the Case Study.. So Far.
I’m not a professional writer, so I realize key points may get lost in translation. To quickly recap a few key points:
- This set-up was alerted in the chat room. Going to show that the first part of our duo can be very valuable. We as humans can’t expect to “see it all” with only two eyeballs. By surrounding yourself with a team, the odds of “catching a move” can be vastly improved.
- Simply put: charts work. The pattern was drawn, and then as time unfolded, as you saw, the price reacted very nicely with the orange trendlines that had been put into place prior, and NOT adjusted in any way, shape, or form.
The Trading Alert Results
A picture is worth a thousand words, so hopefully the below annotations summarize just how beautiful this whole set-up turned out to be.
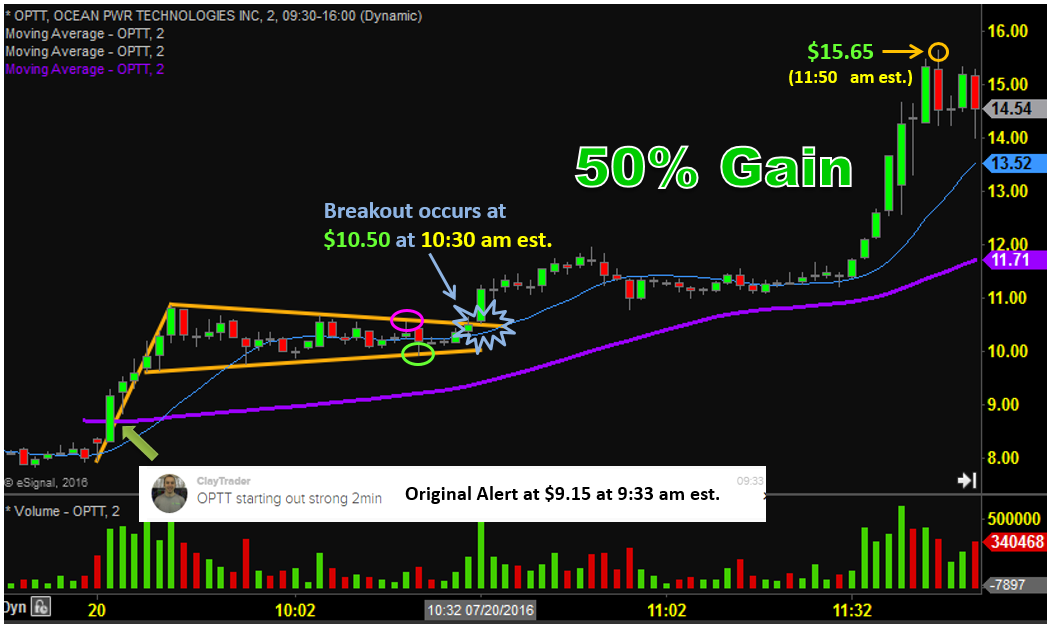
As I noted earlier, I did not run the calculations from the original alert, but for those in the chat room who took advantage of the alert, the price moved from $9.15 to $15.65 giving a profit window of 71%! This all unfolded before noon. Crazy!
Circling back to the learning point of not “giving up” just because you missed the original set-up, for those people that bought the break of $10.50, that still yielded a profit window of 50%! In my opinion, the craziest part here is that the 50% gains came in only an hour and 20 minutes. Case in point, do not give up on a stock just because you miss out on a move, you never know if another profitable set-up will occur.
there is no question about it. These gains were real and they happened quite quickly, but for those that were prepared, there was plenty of opportunity to pull some profits from this trading set-up.
Embrace the Duo and Get Serious!
None of this was theory. None of it was made up in hindsight (this is why I included the actual alerts so you could see the literal times). Charts are a great tool and when combined with a team of eyeballs who are searching for the same things you are, it’s a thing of beauty!
I realize this was only one example from the chat room, so if you would like to see a whole lot of other examples (including some videos), you can go here.
At the end of the day, it’s only $99 for a year’s access to the chat room. Not a month, a YEAR! I’m very confident that over the time span of 12 months, you’ll gain at least $99 worth of value. If you’re still skeptical, I’m not offended at all. Let me give you a behind-the-scenes tour HERE so you can see exactly how it all works.
 Yes, charts can seem very intimidating and overwhelming, I promise though… it’s not nearly as bad as you may be perceiving it. With that being said, I’m not going to sit here and give you some hard sales pitch (sorry if you like being pressured, not gonna happen here). All I’ll say is that if you enjoy the free content I have to offer here on the site, I can very confidently say that I’m sure you would find great value in my premium content/training.
The best value for your money will be my University/mentorship program (get a tour of the program HERE). If this is outside your investment range for education, you can buy individual components of the program here via the courses. I understand there are many courses, so if you’re not sure where to start in regards to the courses, please watch this short video here.
Please let me know if you have any questions. I’d be happy to answer them for you.
Even if you decide not to spend a penny on the site, I hope you still learned a few things and had your eyes opened a bit. Worst case, hopefully I’ve inspired you to dig a bit deeper into learning more about using charts as a tool in your trader toolbox.